The Complete Guide to Measuring Outcomes in Human Services Without Making Staff Hate Documentation
Human services organizations are built to create change in people’s lives.
They help people find stable housing.
They support individuals with disabilities.
They provide behavioral health services.
They strengthen families.
They help people build employment skills.
They support children, seniors, caregivers, newcomers, and communities.
They help people move from crisis toward stability, safety, independence, and belonging.
But doing meaningful work is no longer enough.
Today, nonprofits and human service organizations are expected to prove that their work is making a measurable difference. Funders want evidence. Boards want dashboards. Government agencies want reports. Leadership teams want data they can trust. Program directors want to understand what is working. Communities want accountability. Staff want documentation that feels useful instead of repetitive.
That is why outcomes measurement has become such an important part of human services.
The challenge is that many organizations struggle to measure outcomes in a way that is both meaningful and manageable.
Human Services Organizations Need to Prove Impact Without Drowning Staff in Documentation
Some collect too much data.
Some collect the wrong data.
Some confuse activities with impact.
Some rely on spreadsheets that take hours to update.
Some ask frontline staff to document information that nobody uses.
Some build reports only when a funder deadline is approaching.
Some have strong stories but weak numbers.
Others have plenty of numbers but no clear story of change.
The real question is not only how to measure nonprofit outcomes.
The better question is:
How can human services organizations prove impact, satisfy funders, improve decision-making, and track meaningful outcomes without making staff hate documentation?
This guide answers that question.
It explains why outcome measurement matters, how outputs differ from outcomes, which KPIs human service organizations should track, how to collect useful data, how to automate reporting, what dashboards should include, what mistakes to avoid, what funders usually expect, and how platforms like ShareVision can help organizations make outcome tracking easier.
What Is Outcomes Measurement in Human Services?
Outcomes measurement is the process of tracking whether a program, service, or intervention is creating meaningful change for the people it serves.
In human services, outcomes measurement helps organizations understand whether clients are making progress toward goals such as greater stability, safety, independence, wellness, employment, housing security, community participation, family reunification, skill development, or improved quality of life.
It is not simply about counting how many services were delivered.
Counting services matters, but outcomes measurement goes further. It asks whether those services led to real improvement.
|
Measurement Type
|
What It Answers
|
Example
|
|
Activity tracking
|
What did we do?
|
Staff completed 400 support visits
|
|
Output tracking
|
How much service did we deliver?
|
120 clients received employment coaching
|
|
Outcome tracking
|
What changed because of the service?
|
68% of clients maintained employment for 6 months
|
|
Impact measurement
|
What broader difference did the program make?
|
Long-term unemployment decreased among participants
|
For human service organizations, outcome measurement connects daily work to mission.
It helps answer questions such as:
|
Question
|
Why It Matters
|
|
Are clients making measurable progress?
|
Shows whether services are effective
|
|
Which programs are producing the strongest results?
|
Helps leaders allocate resources
|
|
Where are clients getting stuck?
|
Reveals barriers and service gaps
|
|
Are we meeting funder expectations?
|
Supports funding renewal and compliance
|
|
What story can we tell about our impact?
|
Strengthens advocacy, fundraising, and board reporting
|
|
Are staff documenting what actually matters?
|
Reduces unnecessary administrative burden
|
Outcome measurement should not be a disconnected reporting exercise. It should help organizations learn, improve, and prove the value of their work.
Why Outcome Measurement Matters
Outcome measurement matters because human service organizations operate in environments where accountability, funding, staffing, and client needs are all under pressure.
Organizations need to know whether their services are producing results. Funders need to know whether their investment is creating value. Boards need to understand whether the organization is fulfilling its mission. Staff need to know that their work is leading to progress. Clients deserve services that are responsive, effective, and continuously improving.
1. Outcomes Help Prove Impact
Many human services organizations do life-changing work, but they struggle to communicate that impact clearly.
A statement like “we served 500 people” is important, but it does not explain what changed for those people.
A stronger impact statement would be:
“We supported 500 people through housing stabilization services, and 78% remained housed six months after program completion.”
That second statement is more powerful because it connects service activity to client progress.
|
Basic Reporting
|
Stronger Outcome Reporting
|
|
We provided 1,200 counselling sessions
|
72% of participants reported improved coping skills
|
|
We served 300 families
|
85% completed a family support plan
|
|
We delivered employment workshops
|
64% of participants secured employment within 90 days
|
|
We completed 450 home visits
|
91% of clients maintained required safety check-ins
|
|
We supported 150 individuals in residential care
|
76% increased participation in daily living activities
|
Impact becomes easier to understand when organizations move from counting activity to showing change.
2. Outcomes Help Satisfy Funders
Funders increasingly expect more than service volume. They want to understand what their funding helped achieve.
A funder may ask:
|
Funder Question
|
What They Are Really Asking
|
|
How many people did you serve?
|
Did the program reach the intended population?
|
|
What services did they receive?
|
Was funding used for approved activities?
|
|
What outcomes were achieved?
|
Did the program create measurable value?
|
|
How do you know?
|
Is the data reliable and consistent?
|
|
What did you learn?
|
Is the organization using data to improve?
|
|
What will you do differently?
|
Is the organization accountable and adaptive?
|
Strong nonprofit outcome tracking helps organizations respond confidently to these questions.
It also helps organizations build trust with funders. When reports are accurate, timely, and connected to meaningful outcomes, funders can see that the organization understands both service delivery and performance management.
3. Outcomes Help Improve Programs
Outcome measurement should not exist only for funder reporting.
The best organizations use outcome data to improve services.
For example, if a youth employment program sees that many participants complete training but few maintain employment for 90 days, the issue may not be training attendance. The real gap may be job placement support, transportation, employer fit, workplace readiness, or post-placement coaching.
|
Data Finding
|
Possible Program Insight
|
|
High intake volume but low completion
|
Eligibility, engagement, or retention issue
|
|
Strong attendance but weak outcomes
|
Service content may need improvement
|
|
Good short-term results but poor long-term stability
|
Follow-up support may be insufficient
|
|
Outcomes vary by location
|
Program delivery may be inconsistent
|
|
Certain client groups have lower success rates
|
Services may need to be adapted
|
|
Staff documentation is incomplete
|
Workflow or training may need attention
|
Outcome measurement gives leaders the information they need to improve programs before problems become bigger.
4. Outcomes Help Boards and Executives Make Better Decisions
Executive Directors, CEOs, and boards need more than financial reports. They need program performance data.
Outcome data helps leadership answer:
|
Leadership Question
|
Decision It Supports
|
|
Which programs are delivering the strongest results?
|
Investment and growth decisions
|
|
Which programs are under pressure?
|
Staffing, funding, or redesign decisions
|
|
Are we meeting strategic goals?
|
Board governance and executive planning
|
|
Are we serving the intended population?
|
Mission alignment
|
|
Are funder requirements being met?
|
Contract and grant management
|
|
Where are operational bottlenecks?
|
Process improvement
|
Without outcome data, leadership decisions often depend on anecdotes, delayed reports, or incomplete information.
Stories matter. Staff judgment matters. Client experience matters. But reliable outcome data gives leaders another essential lens.
5. Outcomes Help Staff See the Value of Their Work
Frontline staff often experience documentation as a burden because they do not see how the information is used.
When staff are asked to enter data that disappears into a spreadsheet or annual report, documentation feels disconnected from care.
But when outcome tracking helps staff see client progress, coordinate services, identify risks, and celebrate success, documentation becomes more meaningful.
|
Documentation Feels Burdensome When...
|
Documentation Feels Useful When...
|
|
Staff enter the same information repeatedly
|
Staff document once and the data supports care and reporting
|
|
Data is collected only for funders
|
Data helps staff understand client progress
|
|
Forms are too long or unclear
|
Forms are focused on meaningful information
|
|
Reports are invisible to staff
|
Teams can see dashboards and outcomes
|
|
Notes are disconnected from goals
|
Documentation connects directly to service plans
|
|
Staff never receive feedback
|
Leaders share what the data shows and how it is used
|
Staff do not hate documentation because they dislike accountability. They hate documentation when it feels repetitive, unclear, excessive, or pointless.
Outputs vs. Outcomes: The Most Important Difference
One of the biggest reporting mistakes in human services is confusing outputs with outcomes.
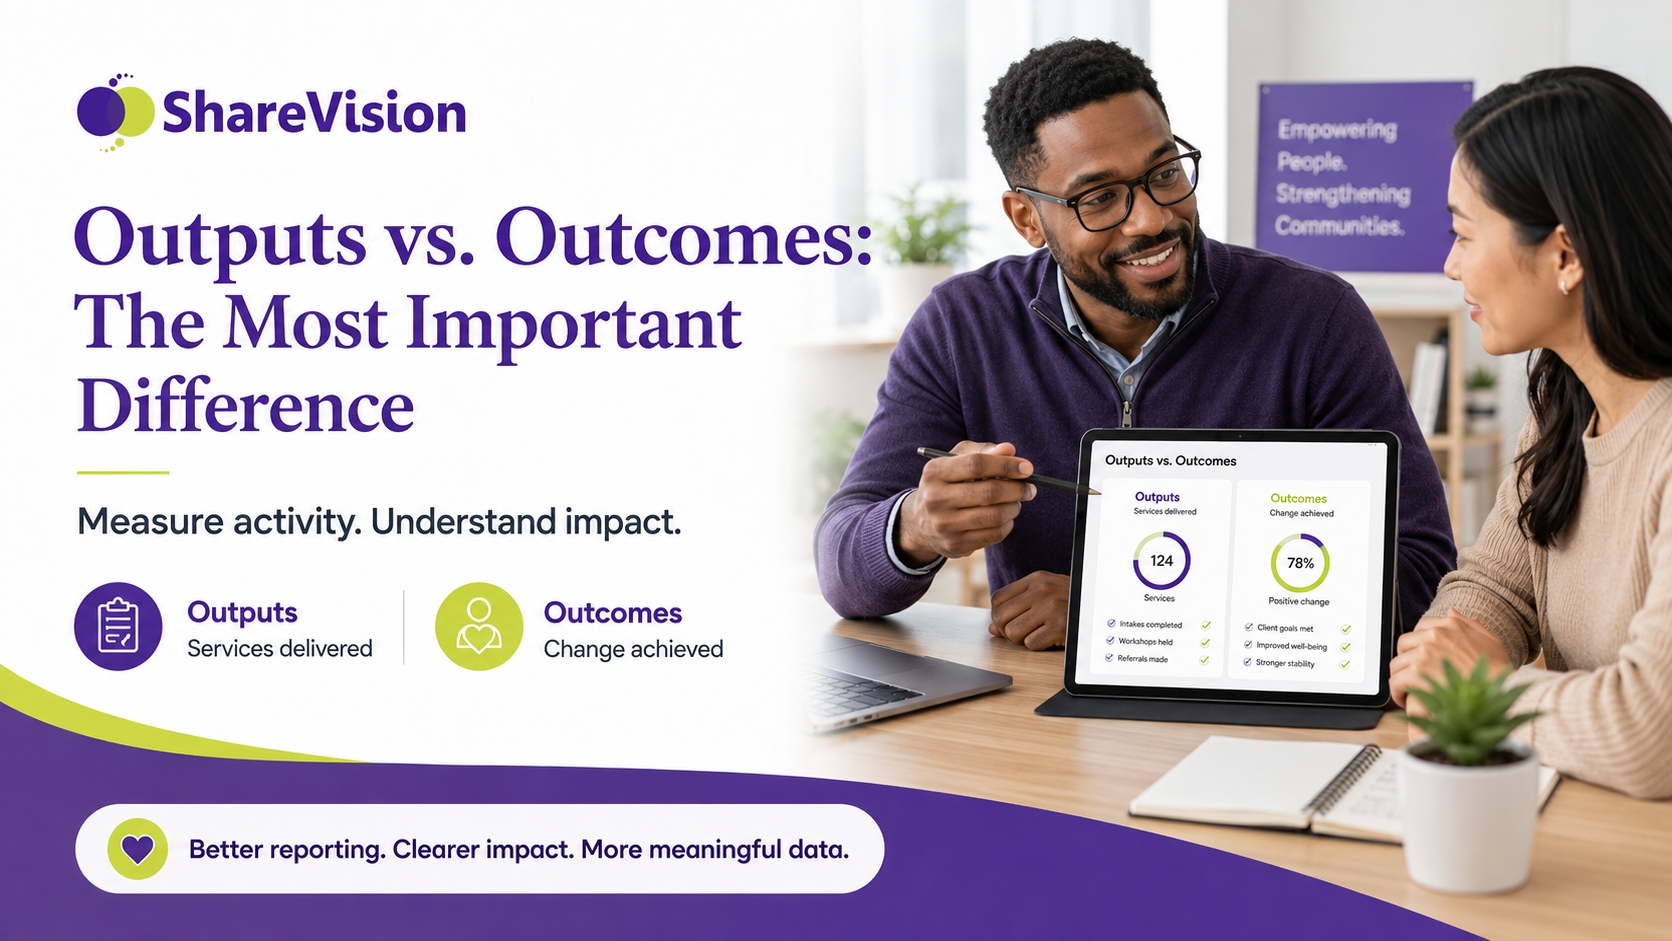
Outputs are the things your organization does. Outcomes are the changes that happen because of what your organization does.
Both matter, but they answer different questions.
|
Category
|
Definition
|
Example
|
|
Input
|
Resources used to deliver services
|
Funding, staff time, facilities, technology
|
|
Activity
|
The work performed
|
Case management, counselling, training, outreach
|
|
Output
|
The amount of work delivered
|
Number of sessions, clients served, forms completed
|
|
Outcome
|
The change experienced by clients
|
Improved stability, employment, safety, wellness
|
|
Impact
|
Broader long-term change
|
Reduced homelessness, stronger community inclusion
|
Example: Employment Support Program
|
Measurement Level
|
Example
|
|
Input
|
3 employment coaches, program funding, training materials
|
|
Activity
|
Resume workshops, job coaching, employer outreach
|
|
Output
|
90 participants completed job readiness training
|
|
Short-term outcome
|
75% improved interview skills
|
|
Intermediate outcome
|
58% secured employment within 90 days
|
|
Long-term outcome
|
46% maintained employment for 6 months
|
|
Impact
|
Participants experienced increased financial stability
|
Example: Housing Stabilization Program
|
Measurement Level
|
Example
|
|
Input
|
Housing workers, rent support funding, referral partnerships
|
|
Activity
|
Housing search support, landlord mediation, benefits navigation
|
|
Output
|
200 clients received housing support
|
|
Short-term outcome
|
70% completed housing stability plans
|
|
Intermediate outcome
|
62% secured stable housing
|
|
Long-term outcome
|
55% remained housed after 12 months
|
|
Impact
|
Reduced housing instability among program participants
|
Example: Disability Services Program
|
Measurement Level
|
Example
|
|
Input
|
Support staff, accessible facilities, community partnerships
|
|
Activity
|
Daily living support, community inclusion, goal planning
|
|
Output
|
1,500 support hours delivered
|
|
Short-term outcome
|
80% of clients participated in goal-setting
|
|
Intermediate outcome
|
67% increased participation in community activities
|
|
Long-term outcome
|
60% maintained or improved independent living skills
|
|
Impact
|
Greater inclusion, autonomy, and quality of life
|
The key is to avoid stopping at outputs.
Outputs show effort. Outcomes show change.
Examples of Strong Human Services Outcomes
Good outcomes are specific, measurable, relevant, and connected to the program’s purpose.
They do not need to be complicated. In fact, the best outcome measures are often simple enough for staff to understand and consistent enough for leadership to track over time.
|
Program Area
|
Weak Outcome Statement
|
Stronger Outcome Statement
|
|
Housing
|
Clients received housing help
|
Clients secure and maintain stable housing
|
|
Employment
|
Clients attended workshops
|
Clients gain employment and retain jobs
|
|
Behavioral health
|
Clients completed sessions
|
Clients report improved coping or reduced symptoms
|
|
Family services
|
Families received support
|
Families complete safety plans and improve stability
|
|
Disability services
|
Clients participated in activities
|
Clients increase independence or community participation
|
|
Youth services
|
Youth joined programs
|
Youth improve school attendance or life skills
|
|
Senior services
|
Seniors received visits
|
Seniors report reduced isolation and improved safety
|
|
Crisis support
|
Clients contacted the program
|
Clients are connected to safe supports within 24 hours
|
Short-Term, Intermediate, and Long-Term Outcomes
Human service outcomes often happen gradually. A client may not move from crisis to stability immediately. That is why it helps to track outcomes in stages.
|
Outcome Stage
|
What It Measures
|
Example
|
|
Short-term outcome
|
Immediate change in knowledge, access, engagement, or planning
|
Client completes an intake and safety plan
|
|
Intermediate outcome
|
Progress in behavior, stability, participation, or service connection
|
Client attends scheduled appointments for 60 days
|
|
Long-term outcome
|
Sustained change in condition, independence, wellness, or quality of life
|
Client maintains stable housing for 12 months
|
This staged approach helps organizations show progress even when long-term outcomes take time.
It also helps staff and funders understand that meaningful change often happens through smaller steps.
KPI Examples by Human Service Organization Type
There is no single set of nonprofit outcome tracking metrics that works for every organization.
A housing program, disability services provider, behavioral health agency, child and family services organization, and employment support program all need different indicators.
The best KPIs are tied to each organization’s mission, service model, funder requirements, and client goals.
KPIs for Housing and Homelessness Services
Housing programs often need to measure access, stability, retention, and prevention.
|
KPI Category
|
Example KPI
|
Why It Matters
|
|
Access
|
Number of clients enrolled
|
Tracks program reach
|
|
Timeliness
|
Average time from referral to first contact
|
Measures responsiveness
|
|
Housing placement
|
Percentage of clients who secure housing
|
Shows service effectiveness
|
|
Housing retention
|
Percentage housed after 6 or 12 months
|
Measures stability
|
|
Prevention
|
Percentage of clients avoiding eviction
|
Shows crisis prevention impact
|
|
Income support
|
Percentage connected to benefits or income
|
Supports long-term stability
|
|
Follow-up
|
Percentage receiving post-placement check-ins
|
Measures continuity of support
|
Example Outcome Statement
“Among clients who completed the housing stabilization program, 68% secured stable housing and 59% remained housed after 12 months.”
KPIs for Disability Services
Disability service organizations may measure independence, inclusion, quality of life, goal progress, safety, and participation.
|
KPI Category
|
Example KPI
|
Why It Matters
|
|
Goal progress
|
Percentage of clients making progress toward personal goals
|
Tracks individualized support
|
|
Community inclusion
|
Number of community participation activities
|
Measures social inclusion
|
|
Independence
|
Percentage improving daily living skills
|
Shows functional progress
|
|
Choice and autonomy
|
Percentage of clients participating in service planning
|
Supports person-centered care
|
|
Safety
|
Number and type of incidents
|
Supports risk management
|
|
Family engagement
|
Percentage of families receiving regular updates
|
Measures communication
|
|
Service consistency
|
Percentage of planned supports delivered
|
Tracks reliability
|
Example Outcome Statement
“During the reporting period, 74% of individuals receiving community inclusion services made progress toward at least one personal goal, and 63% increased participation in community-based activities.”
KPIs for Behavioral Health and Mental Health Services
Behavioral health programs often need to measure access, engagement, symptoms, coping skills, crisis reduction, and continuity of care.
|
KPI Category
|
Example KPI
|
Why It Matters
|
|
Access
|
Time from referral to appointment
|
Measures service accessibility
|
|
Engagement
|
Attendance rate for scheduled sessions
|
Tracks participation
|
|
Completion
|
Percentage completing treatment plans
|
Measures continuity
|
|
Symptom improvement
|
Percentage reporting reduced symptoms
|
Tracks clinical progress
|
|
Coping skills
|
Percentage reporting improved coping
|
Measures practical benefit
|
|
Crisis reduction
|
Reduction in crisis contacts or hospitalizations
|
Shows stabilization
|
|
Follow-up
|
Percentage receiving follow-up after crisis event
|
Supports safety and continuity
|
Example Outcome Statement
“After 12 weeks of services, 71% of participants reported improved coping strategies, and crisis-related contacts decreased among clients who completed their support plan.”
KPIs for Child and Family Services
Child and family programs may measure safety, stability, reunification, parenting capacity, service engagement, and family functioning.
|
KPI Category
|
Example KPI
|
Why It Matters
|
|
Safety planning
|
Percentage of families with completed safety plans
|
Supports risk reduction
|
|
Service engagement
|
Percentage attending scheduled family sessions
|
Measures participation
|
|
Parenting support
|
Percentage completing parenting skills modules
|
Tracks skill development
|
|
Family stability
|
Percentage showing improved family functioning
|
Measures progress
|
|
Reunification
|
Percentage of eligible families reunified
|
Tracks major program outcome
|
|
Referral completion
|
Percentage connected to community supports
|
Measures service coordination
|
|
Follow-up
|
Percentage receiving post-service check-ins
|
Supports continuity
|
Example Outcome Statement
“Of families who completed the family support program, 82% completed a safety plan, and 69% demonstrated improvement in at least one family stability measure.”
KPIs for Employment and Vocational Services
Employment programs need to measure readiness, placement, retention, income improvement, and employer engagement.
|
KPI Category
|
Example KPI
|
Why It Matters
|
|
Readiness
|
Percentage completing job readiness training
|
Tracks preparation
|
|
Skill development
|
Percentage improving resume or interview skills
|
Measures short-term progress
|
|
Placement
|
Percentage securing employment
|
Tracks program effectiveness
|
|
Retention
|
Percentage still employed after 90 days or 6 months
|
Measures sustained success
|
|
Wage growth
|
Average wage at placement
|
Shows economic impact
|
|
Employer engagement
|
Number of active employer partnerships
|
Measures opportunity pipeline
|
|
Support intensity
|
Number of coaching contacts per participant
|
Helps analyze service model
|
Example Outcome Statement
“Among participants who completed employment coaching, 61% secured paid employment within 90 days, and 47% retained employment for at least six months.”
KPIs for Residential Services
Residential programs often track safety, daily support, goal progress, incidents, medication-related tasks, quality of life, and community participation.
|
KPI Category
|
Example KPI
|
Why It Matters
|
|
Service delivery
|
Percentage of scheduled supports completed
|
Tracks consistency
|
|
Goal progress
|
Percentage of residents progressing toward goals
|
Measures person-centered outcomes
|
|
Incident trends
|
Incidents by type, location, or time
|
Supports safety planning
|
|
Health follow-up
|
Percentage of required follow-ups completed
|
Supports care coordination
|
|
Community participation
|
Number of community activities attended
|
Measures inclusion
|
|
Family communication
|
Frequency of family updates
|
Supports transparency
|
|
Documentation timeliness
|
Percentage of notes completed on time
|
Supports compliance
|
Example Outcome Statement
“In the residential program, 88% of scheduled supports were delivered as planned, and 70% of residents made progress toward at least one individualized goal.”
KPIs for Senior Services
Senior services programs may track safety, isolation, wellness, independence, nutrition, caregiver support, and service access.
|
KPI Category
|
Example KPI
|
Why It Matters
|
|
Social connection
|
Percentage reporting reduced isolation
|
Measures quality of life
|
|
Safety
|
Number of safety concerns identified and resolved
|
Supports risk reduction
|
|
Wellness
|
Percentage connected to health or wellness supports
|
Tracks care coordination
|
|
Independence
|
Percentage maintaining independent living status
|
Measures stability
|
|
Nutrition
|
Meals delivered or nutrition needs met
|
Tracks essential support
|
|
Caregiver support
|
Percentage of caregivers receiving resources
|
Measures family support
|
|
Follow-up
|
Percentage receiving regular check-ins
|
Supports prevention
|
Example Outcome Statement
“Among seniors receiving regular outreach, 76% reported reduced social isolation, and 84% remained safely in their homes during the reporting period.”
How to Collect Meaningful Data Without Overwhelming Staff
Outcome measurement fails when organizations ask staff to collect too much information without explaining why it matters.
The goal should be to collect the least amount of data needed to answer the most important questions.
Meaningful data should be:
|
Data Quality
|
What It Means
|
|
Relevant
|
Connected to client progress, program goals, or funder requirements
|
|
Measurable
|
Clear enough to track consistently
|
|
Useful
|
Helps staff, managers, or leaders make decisions
|
|
Realistic
|
Practical for staff to collect during normal workflows
|
|
Timely
|
Available when decisions or reports are needed
|
|
Reliable
|
Collected consistently across staff, programs, and locations
|
The Best Data Is Collected During the Work
The easiest data to collect is data that naturally fits into the service workflow.
For example:
|
Workflow Moment
|
Useful Data to Capture
|
|
Intake
|
Client needs, eligibility, referral source, baseline status
|
|
Assessment
|
Risk factors, strengths, goals, barriers
|
|
Service planning
|
Desired outcomes, action steps, timelines
|
|
Case notes
|
Services delivered, progress, concerns, next steps
|
|
Reviews
|
Goal progress, changes in needs, updated plans
|
|
Discharge
|
Outcome status, referrals, completion reason
|
|
Follow-up
|
Sustained progress, ongoing barriers, long-term results
|
If outcome tracking requires staff to complete a separate reporting process after the real work is done, it will feel like extra paperwork.
A better approach is to embed outcome data into forms, notes, service plans, and reviews that staff already use.
Build an Outcome Measurement Framework
A simple outcome measurement framework helps organizations connect mission, services, data, and reporting.
|
Framework Element
|
Question to Answer
|
Example
|
|
Need
|
What problem are we addressing?
|
Clients are experiencing housing instability
|
|
Service
|
What do we provide?
|
Housing search, landlord mediation, benefit support
|
|
Output
|
What did we deliver?
|
300 clients received housing support
|
|
Outcome
|
What changed?
|
65% secured stable housing
|
|
Indicator
|
How do we measure the change?
|
Housing status at 3, 6, and 12 months
|
|
Data source
|
Where does the data come from?
|
Intake, case notes, follow-up forms
|
|
Reporting frequency
|
How often do we review it?
|
Monthly dashboard and quarterly funder report
|
This structure helps organizations avoid collecting random data.
Every metric should have a purpose.
Practical Outcome Measurement Template
Human service organizations can use the template below to design better outcome measures.
|
Program Goal
|
Outcome
|
Indicator
|
Data Source
|
Collection Point
|
Reporting Use
|
|
Improve housing stability
|
Clients maintain stable housing
|
Housing status after 6 months
|
Follow-up form
|
6-month review
|
Funder report
|
|
Increase employment
|
Clients secure paid work
|
Employment status
|
Case note or employment form
|
90 days after coaching
|
Program dashboard
|
|
Improve family safety
|
Families complete safety planning
|
Safety plan completion
|
Service plan
|
Intake and review
|
Compliance report
|
|
Reduce isolation
|
Seniors feel more socially connected
|
Self-reported isolation score
|
Wellness check form
|
Monthly
|
Board report
|
|
Build independence
|
Clients improve daily living skills
|
Goal progress rating
|
Service plan review
|
Quarterly
|
Program evaluation
|
A template like this makes outcome tracking easier to design, explain, and implement.
Automating Human Services Reporting
Manual reporting is one of the biggest reasons outcome measurement becomes frustrating.
When staff document services in one place, track outcomes in another, and managers build reports in spreadsheets, reporting becomes time-consuming and error-prone.
Automation can reduce that burden.
Automated reporting does not mean removing human judgment. It means using systems to organize and calculate information that staff already collect.
|
Manual Reporting Task
|
Automated Reporting Alternative
|
|
Counting clients served from spreadsheets
|
Dashboard updates automatically from client records
|
|
Copying case note data into funder reports
|
Reports pull from structured service documentation
|
|
Tracking overdue reviews manually
|
Automated reminders and compliance dashboards
|
|
Calculating outcome percentages by hand
|
System calculates outcome indicators
|
|
Searching files before audits
|
Documentation is stored and filtered in one platform
|
|
Building board reports from scratch
|
Standard dashboards show current program metrics
|
Automation works best when the right data is captured in the right fields at the right time.
This is why workflow design matters. If the system is built around meaningful data collection, reporting becomes a byproduct of good documentation instead of an extra task.
Dashboard Examples for Human Services Organizations
Dashboards help organizations turn data into visibility.
A good dashboard does not show every possible metric. It shows the information that helps staff, supervisors, program leaders, and executives make decisions.
Different roles need different dashboards.
Executive Dashboard
An executive dashboard should show high-level performance, risk, and impact across the organization.
|
Metric
|
Why It Matters
|
|
Total clients served
|
Shows reach
|
|
Program enrollment by service area
|
Shows demand and capacity
|
|
Outcome achievement rate
|
Shows impact
|
|
Waitlist volume
|
Shows access pressure
|
|
Documentation completion rate
|
Shows compliance health
|
|
Incidents by category
|
Shows risk trends
|
|
Funder report status
|
Shows reporting readiness
|
|
Staff caseload distribution
|
Shows workload balance
|
Program Director Dashboard
A program director dashboard should help managers understand program performance and service delivery.
|
Metric
|
Why It Matters
|
|
Active clients by program
|
Tracks service volume
|
|
Referrals received and accepted
|
Shows intake flow
|
|
Services delivered
|
Tracks program activity
|
|
Goal progress by client group
|
Shows outcome movement
|
|
Overdue reviews
|
Supports compliance and supervision
|
|
Staff documentation timeliness
|
Identifies follow-up needs
|
|
Discharge reasons
|
Reveals program completion patterns
|
|
Outcome trends over time
|
Supports service improvement
|
Supervisor Dashboard
A supervisor dashboard should support daily team management.
|
Metric
|
Why It Matters
|
|
Assigned caseloads
|
Shows workload distribution
|
|
Missing case notes
|
Supports documentation completion
|
|
Upcoming reviews
|
Helps manage deadlines
|
|
Overdue follow-ups
|
Reduces service gaps
|
|
Incident follow-up status
|
Supports safety and accountability
|
|
Client risk flags
|
Supports timely intervention
|
|
Staff task completion
|
Helps supervisors coach teams
|
Frontline Staff Dashboard
A frontline dashboard should help staff manage their work, not overwhelm them.
|
Metric or Widget
|
Why It Matters
|
|
Today’s tasks
|
Clarifies priorities
|
|
Upcoming appointments
|
Supports scheduling
|
|
Overdue documentation
|
Helps staff stay compliant
|
|
Client goals
|
Keeps services connected to outcomes
|
|
Required forms
|
Reduces missed paperwork
|
|
Follow-up reminders
|
Supports continuity of care
|
A frontline dashboard should not feel like surveillance. It should help staff organize work and deliver better support.
Common Human Services Reporting Mistakes
Many organizations collect data for years without getting the insight they need.
The problem is usually not lack of effort. It is that the reporting system is not designed well.
|
Mistake
|
Why It Hurts Reporting
|
Better Approach
|
|
Tracking too many metrics
|
Staff become overwhelmed and reports lose focus
|
Choose a small set of meaningful indicators
|
|
Confusing outputs with outcomes
|
Reports show activity but not impact
|
Track both service volume and client change
|
|
Collecting data nobody uses
|
Staff lose trust in documentation
|
Explain how each data point supports decisions
|
|
Relying on spreadsheets
|
Data becomes inconsistent and hard to maintain
|
Use centralized reporting tools
|
|
Waiting until reports are due
|
Data cleanup becomes stressful
|
Review dashboards regularly
|
|
Ignoring baseline data
|
Change is hard to measure
|
Capture client status at intake
|
|
Using vague outcome measures
|
Results are difficult to interpret
|
Define clear indicators
|
|
Not training staff
|
Documentation becomes inconsistent
|
Provide role-based training
|
|
Reporting only successes
|
Funders may question credibility
|
Include learning, barriers, and improvement plans
|
|
Treating data as compliance only
|
Missed opportunity for program improvement
|
Use outcomes to guide decisions
|
The strongest reporting systems are simple, consistent, and useful.
What Funders Expect From Outcome Reporting
Funders want to know that their investment is making a difference.
Different funders have different requirements, but many expect some combination of service volume, client demographics, outputs, outcomes, narrative explanation, financial accountability, and lessons learned.
|
Funder Expectation
|
What to Provide
|
|
Clear program purpose
|
Explain what need the program addresses
|
|
Service reach
|
Report how many people were served
|
|
Target population
|
Show who received services
|
|
Activities delivered
|
Describe what the program provided
|
|
Outputs
|
Count services, sessions, referrals, or completed activities
|
|
Outcomes
|
Show measurable client or community change
|
|
Data method
|
Explain how outcomes were tracked
|
|
Challenges
|
Identify barriers or unexpected issues
|
|
Learning
|
Show how data will improve the program
|
|
Financial alignment
|
Connect funding to approved activities
|
Funders do not usually expect perfection. They expect credible reporting.
A credible outcome report explains not only what went well, but also what the organization learned and how it is improving.
Strong Funder Reporting Example
|
Reporting Element
|
Example
|
|
Need
|
Many clients entered the program at risk of eviction
|
|
Service
|
Staff provided housing navigation, landlord mediation, and benefits support
|
|
Output
|
210 clients received housing stabilization services
|
|
Outcome
|
72% avoided eviction during the reporting period
|
|
Learning
|
Clients with benefits navigation were more likely to remain housed
|
|
Improvement
|
The program will add benefits screening earlier in intake
|
This type of reporting tells a fuller story.
It connects need, service, output, outcome, learning, and improvement.
How to Tell a Strong Impact Story
Outcome data is powerful, but numbers alone are not enough.
Human services organizations also need to tell the story behind the numbers.
A strong impact story combines:
|
Element
|
Purpose
|
|
Human need
|
Explains the problem
|
|
Program response
|
Shows what the organization did
|
|
Data
|
Proves scale and results
|
|
Client experience
|
Adds human context
|
|
Learning
|
Shows reflection and improvement
|
|
Next step
|
Explains how the organization will build on success
|
Impact Story Framework
“Many clients entered the program facing [need or challenge]. Through [service or intervention], staff helped clients [activity or support]. During the reporting period, [number] clients received services, and [percentage] achieved [outcome]. Staff identified [learning or barrier], and the organization is using this insight to [improvement].”
Example Impact Story
“Many families entered the program experiencing housing instability, income disruption, and difficulty navigating community supports. Through case management, landlord mediation, and benefits navigation, staff helped families create housing stability plans and connect to practical resources. During the reporting period, 210 families received support, and 72% avoided eviction. Staff found that families who received benefits navigation within the first two weeks were more likely to remain housed, so the program is adding benefits screening earlier in the intake process.”
This is stronger than simply reporting a number because it explains meaning.
How ShareVision Supports Outcome Measurement and Human Services Reporting
ShareVision helps human service organizations track outcomes, streamline documentation, and generate reports without relying on disconnected spreadsheets or repetitive manual work.
For organizations trying to improve nonprofit outcome tracking, ShareVision provides a centralized platform where client records, service notes, forms, workflows, outcomes, dashboards, and reports can work together.
Instead of asking staff to document in one place and report in another, ShareVision helps organizations build outcome tracking directly into daily workflows.
|
ShareVision Capability
|
How It Supports Outcomes Measurement
|
|
Centralized client records
|
Keeps client information, goals, services, and progress in one place
|
|
Custom digital forms
|
Captures structured outcome data during intake, review, and follow-up
|
|
Case notes
|
Connects service documentation to client goals and progress
|
|
Goal tracking
|
Helps staff document progress toward individualized outcomes
|
|
Dashboards
|
Gives leaders real-time visibility into program performance
|
|
Reporting tools
|
Reduces manual reporting for funders, boards, and leadership
|
|
Workflow automation
|
Reminds staff about reviews, follow-ups, and required documentation
|
|
Role-based permissions
|
Protects sensitive client information
|
|
Mobile access
|
Allows staff to document services in the field
|
|
Configurable workflows
|
Supports different outcome measures by program type
|
ShareVision is especially useful for organizations that operate multiple programs with different reporting needs.
A disability services program may need to track goal progress, community participation, and daily living skills. A housing program may need to track housing status, eviction prevention, and follow-up stability. A family services program may need to track safety planning, family stability, and referral completion.
ShareVision allows each program to collect the data that matters while maintaining centralized reporting across the organization.
ShareVision Outcome Tracking Examples
Example 1: Housing Stability Program
|
Workflow Step
|
Data Captured in ShareVision
|
Reporting Use
|
|
Intake
|
Housing status, eviction risk, referral source
|
Baseline and demographic reporting
|
|
Service plan
|
Housing goal, barriers, support actions
|
Case planning and goal tracking
|
|
Case notes
|
Landlord contact, benefits support, housing search
|
Service activity reporting
|
|
Review
|
Housing status update, progress rating
|
Outcome measurement
|
|
Follow-up
|
Housing retained at 6 or 12 months
|
Long-term outcome reporting
|
Example Outcome Report
“During the quarter, 180 clients received housing stabilization services. Of clients with a completed 6-month follow-up, 66% remained housed, and 74% completed at least one housing stability goal.”
Example 2: Disability Services Program
|
Workflow Step
|
Data Captured in ShareVision
|
Reporting Use
|
|
Person-centered plan
|
Client goals, preferences, support needs
|
Individualized planning
|
|
Service notes
|
Daily support activities and progress
|
Service delivery tracking
|
|
Goal review
|
Progress toward independence or inclusion goals
|
Outcome reporting
|
|
Incident documentation
|
Safety events and follow-up actions
|
Risk and compliance reporting
|
|
Dashboard
|
Goal progress by program or location
|
Program management
|
Example Outcome Report
“Across community inclusion programs, 71% of individuals made progress toward at least one personal goal, and 64% increased participation in community-based activities during the reporting period.”
Example 3: Employment Services Program
|
Workflow Step
|
Data Captured in ShareVision
|
Reporting Use
|
|
Intake
|
Employment status, skills, barriers
|
Baseline data
|
|
Coaching notes
|
Resume support, interview prep, employer contacts
|
Service activity
|
|
Placement form
|
Employer, role, wage, start date
|
Placement reporting
|
|
Follow-up
|
Employment status at 90 days and 6 months
|
Retention outcomes
|
|
Dashboard
|
Placement rate, retention rate, active caseloads
|
Program performance
|
Example Outcome Report
“Among participants who completed employment coaching, 62% secured paid employment within 90 days, and 49% retained employment for at least six months.”
Before and After: Outcome Measurement With Better Systems
|
Before
|
After
|
|
Outcomes are tracked in spreadsheets
|
Outcomes are captured in structured forms and dashboards
|
|
Staff document services separately from reporting
|
Service documentation feeds reporting automatically
|
|
Funders receive delayed reports
|
Reports can be generated from current system data
|
|
Managers manually calculate KPIs
|
Dashboards show KPIs in real time
|
|
Staff do not know how data is used
|
Staff can see client goals and progress
|
|
Reports focus mostly on activities
|
Reports connect activities to outcomes
|
|
Data quality depends on manual cleanup
|
Standardized fields improve consistency
|
|
Leadership lacks organization-wide visibility
|
Executives can compare outcomes across programs
|
A Practical Roadmap for Better Outcome Measurement
Human service organizations do not need to fix everything at once.
A practical approach starts with a small number of meaningful outcomes and builds from there.
Step 1: Define the Questions You Need to Answer
Start with the questions that matter most.
|
Audience
|
Key Questions
|
|
Funders
|
What changed because of the program?
|
|
Board
|
Are we fulfilling our mission effectively?
|
|
Executives
|
Which programs are producing results?
|
|
Program Directors
|
Where are clients making progress or getting stuck?
|
|
Supervisors
|
Are staff completing required documentation?
|
|
Frontline Staff
|
What goals are clients working toward?
|
Step 2: Choose a Small Set of Outcomes
Avoid trying to measure everything.
Choose 3 to 5 core outcomes per program.
|
Program Type
|
Core Outcomes to Consider
|
|
Housing
|
Housing placement, housing retention, eviction prevention
|
|
Employment
|
Job readiness, placement, retention
|
|
Disability services
|
Goal progress, independence, community inclusion
|
|
Family services
|
Safety planning, family stability, referral completion
|
|
Behavioral health
|
Engagement, symptom improvement, crisis reduction
|
|
Senior services
|
Reduced isolation, safety, independent living
|
Step 3: Define Each Indicator Clearly
Every outcome needs a clear indicator.
|
Outcome
|
Indicator
|
|
Improved housing stability
|
Client remains housed after 6 months
|
|
Increased employment
|
Client secures paid employment within 90 days
|
|
Improved coping
|
Client reports improved coping on review form
|
|
Increased independence
|
Client progresses on daily living goal
|
|
Reduced isolation
|
Client reports increased social connection
|
Step 4: Decide Where the Data Will Be Collected
Data should be collected as part of normal service delivery.
|
Data Point
|
Best Collection Point
|
|
Baseline status
|
Intake
|
|
Goals
|
Service plan
|
|
Services delivered
|
Case note
|
|
Progress
|
Review form
|
|
Long-term status
|
Follow-up
|
|
Completion reason
|
Discharge form
|
Step 5: Build Reports and Dashboards
Once data collection is consistent, build dashboards for each audience.
|
Audience
|
Dashboard Focus
|
|
Executives
|
Impact, risk, growth, strategic goals
|
|
Program Directors
|
Program performance, outcomes, service volume
|
|
Supervisors
|
Documentation, caseloads, follow-ups
|
|
Frontline Staff
|
Tasks, goals, overdue items, client progress
|
|
Funders
|
Outputs, outcomes, demographics, narrative results
|
Step 6: Review and Improve
Outcome measurement should evolve.
Organizations should regularly ask:
|
Review Question
|
Why It Matters
|
|
Are we using the data we collect?
|
Eliminates unnecessary documentation
|
|
Are the indicators still meaningful?
|
Keeps reporting aligned with program goals
|
|
Are staff documenting consistently?
|
Improves reliability
|
|
Do dashboards support decisions?
|
Ensures reporting is useful
|
|
Are funders getting what they need?
|
Supports funding relationships
|
|
What have we learned from the data?
|
Drives program improvement
|
Frequently Asked Questions About Measuring Nonprofit Outcomes
How do you measure nonprofit outcomes?
To measure nonprofit outcomes, define the change your program is trying to create, choose clear indicators, collect baseline and follow-up data, track progress consistently, and report both quantitative results and qualitative learning. For human services, this often means measuring changes in housing stability, employment, safety, wellness, independence, family stability, or community participation.
What is outcomes measurement?
Outcomes measurement is the process of tracking whether a service or program creates meaningful change for the people it serves. It goes beyond counting activities by measuring progress, results, or improvements connected to the organization’s mission.
What is the difference between outputs and outcomes?
Outputs measure what an organization did, such as the number of clients served or sessions delivered. Outcomes measure what changed because of those services, such as clients securing housing, improving coping skills, gaining employment, or increasing independence.
What are examples of nonprofit outcomes?
Examples of nonprofit outcomes include clients maintaining stable housing, participants securing employment, families completing safety plans, individuals improving daily living skills, seniors reporting reduced isolation, or youth improving school attendance.
Why do funders care about outcome tracking?
Funders care about outcome tracking because they want to understand whether their investment is producing meaningful results. Strong outcome data helps demonstrate accountability, effectiveness, learning, and impact.
How can nonprofits track outcomes without overwhelming staff?
Nonprofits can reduce staff burden by collecting only meaningful data, embedding outcome tracking into existing workflows, using structured forms, automating reports, avoiding duplicate entry, and showing staff how the data supports client care and program improvement.
What should be included in a human services dashboard?
A human services dashboard may include clients served, active caseloads, outcome achievement rates, documentation completion, overdue reviews, incidents, referrals, waitlists, service utilization, and program-specific KPIs.
What are common outcome reporting mistakes?
Common mistakes include tracking too many metrics, confusing outputs with outcomes, collecting data nobody uses, relying on spreadsheets, failing to capture baseline data, using vague indicators, and waiting until funder reports are due to review data.
Final Thoughts: Better Outcome Measurement Should Make Work Clearer, Not Harder
Outcome measurement should help human service organizations prove impact, improve programs, satisfy funders, and support better decisions.
It should not create unnecessary paperwork.
The strongest approach is simple: measure what matters, collect data during normal workflows, use dashboards to make information visible, and show staff how documentation connects to client progress.
Human services work is complex. Not every meaningful change can be captured perfectly in a metric. A client’s confidence, safety, dignity, belonging, or independence may not always fit neatly into a spreadsheet.
But thoughtful outcome measurement helps organizations tell a clearer story.
It shows what services were delivered.
It shows what changed.
It shows what still needs improvement.
It helps funders understand value.
It helps leaders make better decisions.
It helps staff see progress.
It helps organizations strengthen their mission.
The goal is not to turn people into numbers.
The goal is to use better information to serve people better.
Ready to Improve Outcome Tracking and Human Services Reporting?
If your organization is relying on spreadsheets, manual reports, disconnected systems, or inconsistent documentation, outcome measurement may be harder than it needs to be.
ShareVision helps human service organizations centralize client records, streamline documentation, track outcomes, automate reporting, and build dashboards that make impact easier to prove.
Book a ShareVision demo to see how a configurable human services case management platform can help your organization measure outcomes, satisfy funders, and reduce reporting burden for staff.